Most small and medium businesses are sitting on more useful data than they realise: sales spreadsheets, accounting software, website analytics, even a WhatsApp order history. The problem is not a lack of data — it is that nobody has time to look at it properly.
Start with the questions, not the tools
Before building anything, write down the three to five decisions you make every month. For example:
- Which products or services should we promote next month?
- Which customers have stopped buying, and why?
- Which marketing channel brings the most paying customers?
- Where are we losing time or money in delivery?
Each question tells you which numbers matter. Everything else can wait.
Put the numbers in one place
Data spread across five spreadsheets and three apps is hard to trust. The first job is to bring it together and clean it up: consistent product names, dates in one format, duplicate customers merged.
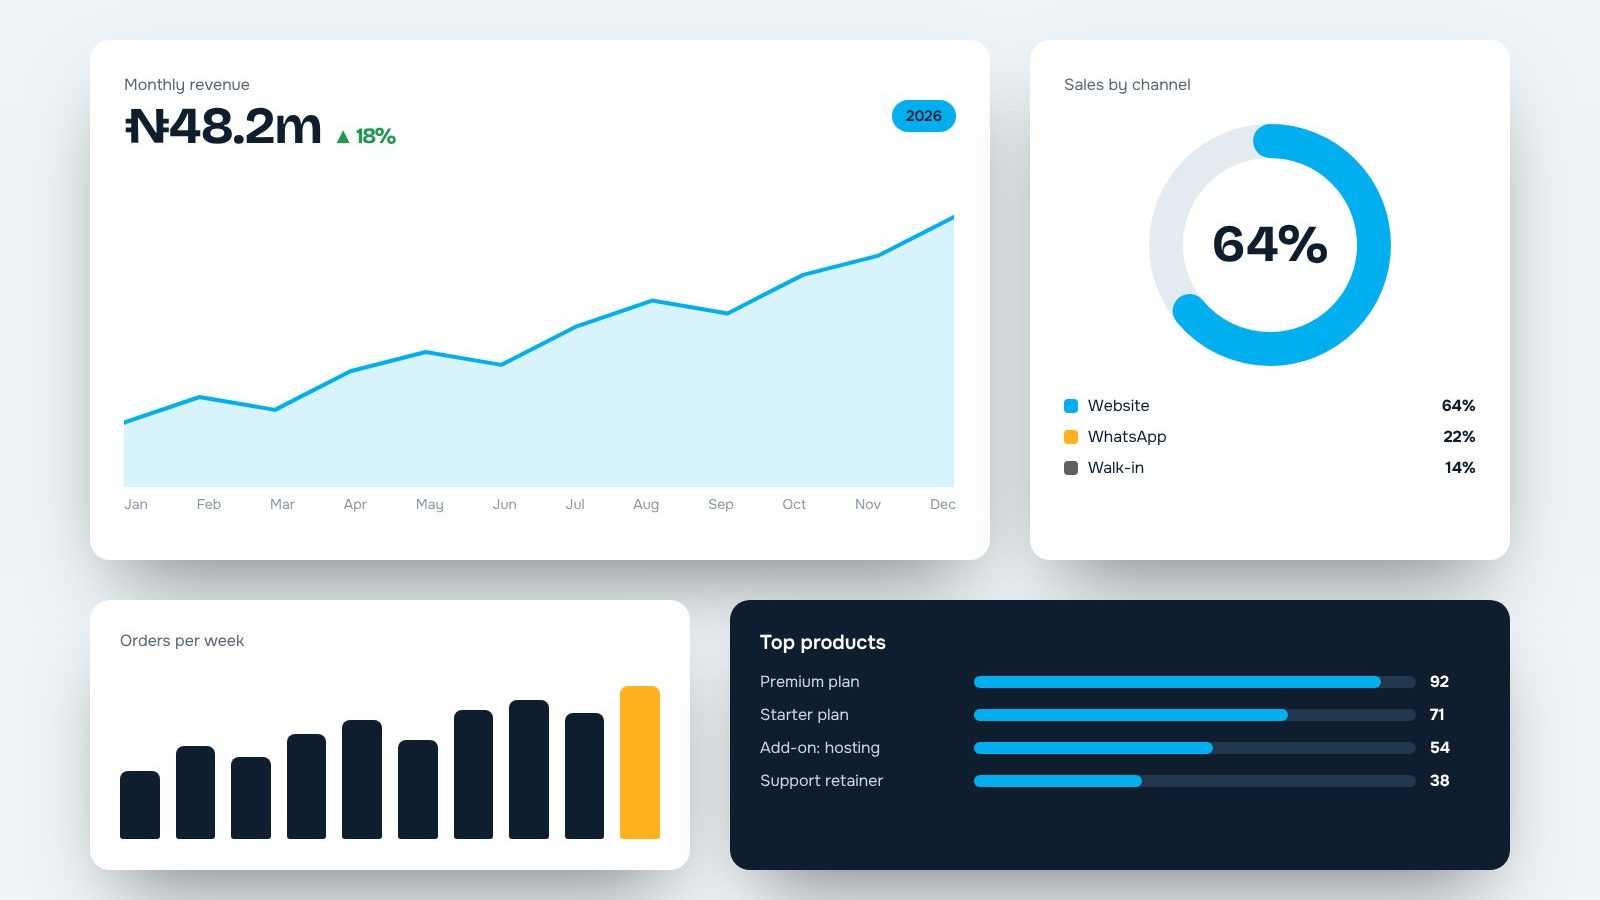
Example: weekly orders, before and after a simple dashboard
Illustrative data for a small retail business — your numbers will differ
Build a dashboard people will actually open
- One page. If it needs scrolling, it is too much.
- Five to eight numbers that answer your questions.
- Trends, not just totals — this month compared with last month and last year.
- Updates automatically, so nobody has to rebuild it on Friday night.
Free tools like Google Looker Studio connect to Google Sheets, Google Analytics and many accounting tools, so a useful dashboard does not have to cost much.
Make it a habit
A dashboard only helps if someone looks at it. Book 30 minutes every Monday to review it as a team and agree one action. Small, regular decisions add up quickly.
Want help making sense of your numbers? See our data consultancy service.
Want this done for your business?
Tell us where you are and where you want to be. We will reply within one working day.